

Q3 EV Sales Rebound, but the Year-Ago Comparison Needs Context
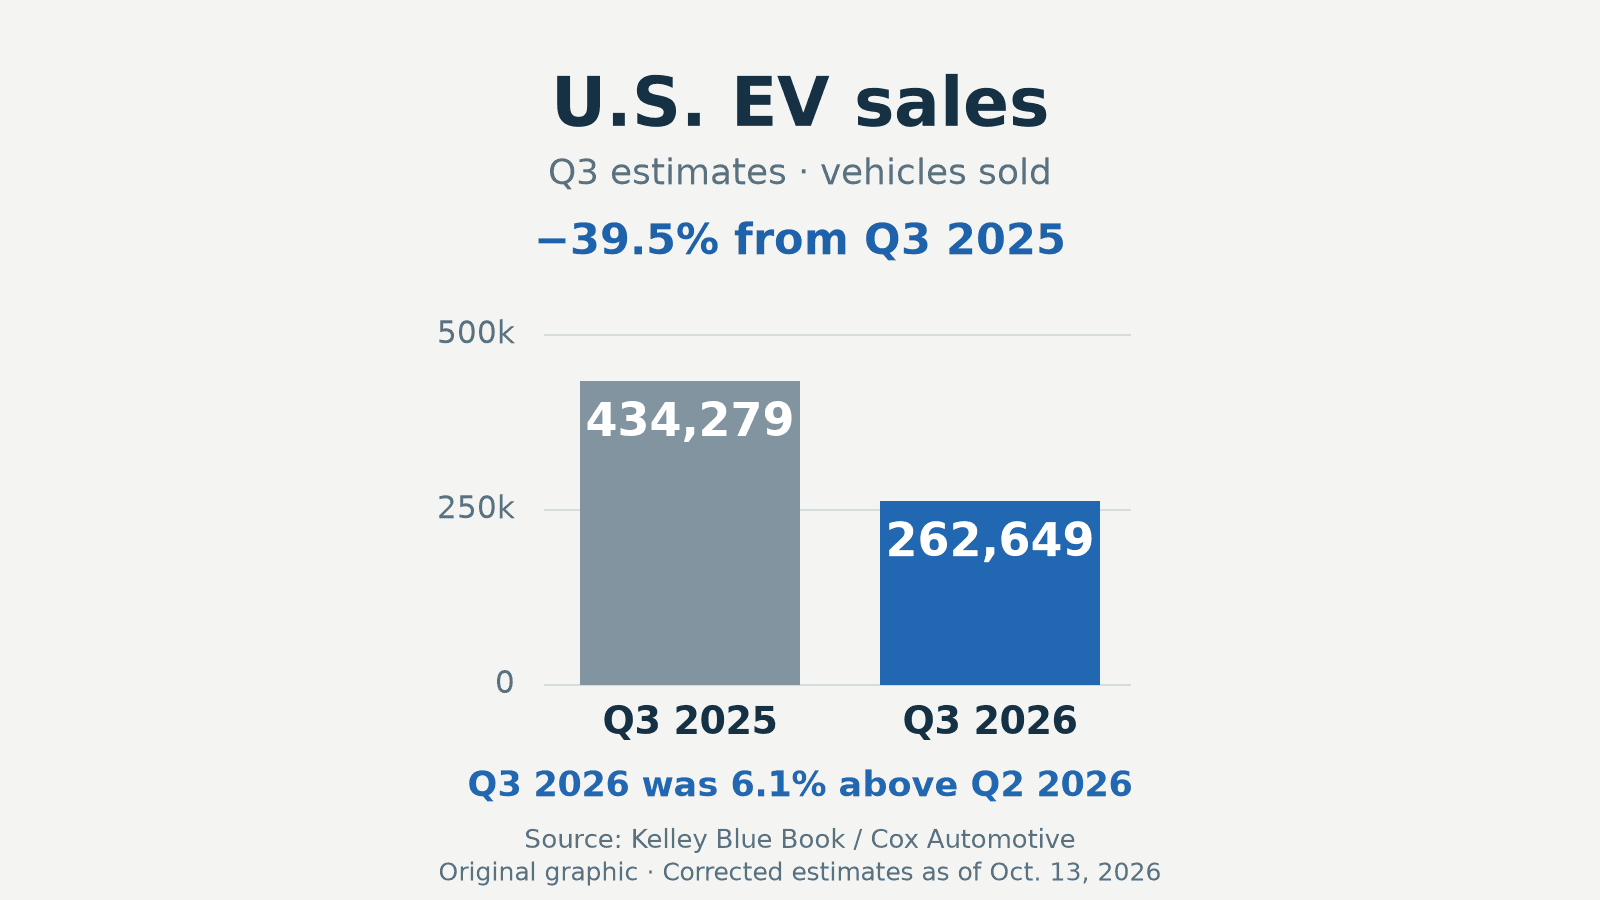
The U.S. battery-electric market gained momentum during the third quarter, according to Kelley Blue Book estimates published by Cox Automotive on October 12. Estimated sales reached 262,649 vehicles, up 6.1% from the previous quarter. Sales were still 39.5% below the exceptionally strong third quarter of 2025.
Those two comparisons answer different questions. Sequential growth describes movement since the spring quarter. The annual comparison measures performance against a year-earlier period in which buyers accelerated purchases ahead of expiring federal incentives. Neither percentage should be presented without its comparison period.
Use the corrected report and its definitions
The corrected sales report, dated October 13, lists 434,279 battery-electric vehicles for Q3 2025 and 262,649 for Q3 2026. The latter is the highest quarterly volume since the 2025 peak. These are estimates of new-vehicle sales; they do not describe used-EV transactions or combine conventional hybrids with battery-electric models.
The report separately identifies fuel-cell vehicles. Keeping that distinction visible prevents a small change in category definitions from being mistaken for a change in consumer demand. A reader comparing other datasets should first check whether the other report includes plug-in hybrids, fuel-cell vehicles, registrations, deliveries or a different geographic market.
A national sales total does not price an individual car
A quarterly total describes the market’s scale and direction. It does not establish the asking price, equipment, battery condition or future resale value of a particular vehicle. A model can suit a buyer even when its brand’s quarterly volume falls; a fast-growing brand still requires the same individual assessment.
The Department of Energy’s discussion of EV benefits and costs identifies several parts of that assessment, including purchase cost, electricity use, charging access and maintenance. The price of energy and the way a vehicle is used affect the result. A national sales trend cannot substitute for those household-specific inputs.
For a simple illustration, an EV using 30 kilowatt-hours per 100 miles at $0.18 per kilowatt-hour has an energy cost of $5.40 per 100 miles. A gasoline vehicle returning 30 mpg at $4 per gallon uses about $13.33 of fuel over the same distance. These hypothetical inputs illustrate the calculation only; they exclude purchase price, charging installation, insurance and other ownership costs.
Translate market interest into an ownership plan
The Department of Energy’s consumer EV guide recommends considering daily driving and longer journeys separately. Establish where routine charging would happen, then check compatible stations along the routes that matter. A charging plan that works for a homeowner with dedicated parking can differ substantially from one for a driver relying on shared or public equipment.
When comparing used vehicles, confirm the specific year, powertrain and included charging equipment. A battery-health report can add evidence about a used EV, provided its date, method and vehicle identity are clear. It does not turn a general market report into a vehicle-specific condition assessment.
The third-quarter recovery is a useful development to follow. Its practical value is in understanding the size and changing composition of the market, while keeping the purchase decision tied to the actual car, its costs and the driver’s charging routine. Future quarters will show whether the sequential improvement continues.
0 comment(s) so far on Q3 EV Sales Rebound, but the Year-Ago Comparison Needs Context