

Hybrid Value: MPG Scores, Fuel Cost and Payback
Hybrid Economics
Updated October 16, 2026
A hybrid with a strong fuel-economy rating can still take years to recover a higher purchase price through gasoline savings. Cars.com’s 2026 value ranking offers one way to narrow a shopping list. Working out what two actual vehicles would cost you requires a different calculation: annual miles divided by miles per gallon, then multiplied by the price of fuel.
What the Cars.com score measures
In its June 16, 2026 comparison, Cars.com divided each vehicle’s EPA combined MPG by its base MSRP plus destination charge, then multiplied the result by 1,000. The study covered model-year 2026 hybrids that do not plug in. Higher fuel economy and a lower starting price produce a higher score.
Its compact-car winner, the 2026 Hyundai Elantra Hybrid, illustrates the arithmetic: 54 MPG divided by the article’s $26,695 price including destination, multiplied by 1,000, rounds to 2.02. Those are the publication’s dated comparison inputs, rather than a current quote for a car for sale.
Cars.com expressly left out equipment differences, quality judgments, ownership costs and departures from EPA estimates. The score therefore helps identify vehicles worth comparing; it does not calculate how much a buyer will save or whether a particular trim meets that buyer’s needs.
Turn MPG into gallons before dollars
The calculation starts with fuel consumed. Suppose two hypothetical gasoline vehicles cover the same 12,000 miles a year, use fuel costing $3.50 per gallon, and achieve 30 and 45 MPG respectively. Assume the same required fuel grade and no difference in the driving task.
| Calculation | 30-MPG vehicle | 45-MPG vehicle |
|---|---|---|
| Annual miles ÷ MPG | 12,000 ÷ 30 | 12,000 ÷ 45 |
| Gallons per year | 400 | 266.67 |
| Gallons × $3.50 | $1,400 | $933.33 |
The difference is about $467 a year. Multiplying annual miles by MPG would give the wrong result: a more efficient vehicle uses fewer gallons for the same distance. Keep unrounded values in the calculation and round the final dollar amounts for display.
MPG gains also need context. Moving from 30 to 45 MPG is a 50% increase in MPG, but it reduces this example’s gasoline consumption by one-third. Expressing the result in gallons makes that relationship easier to see.
Payback changes with mileage and purchase price
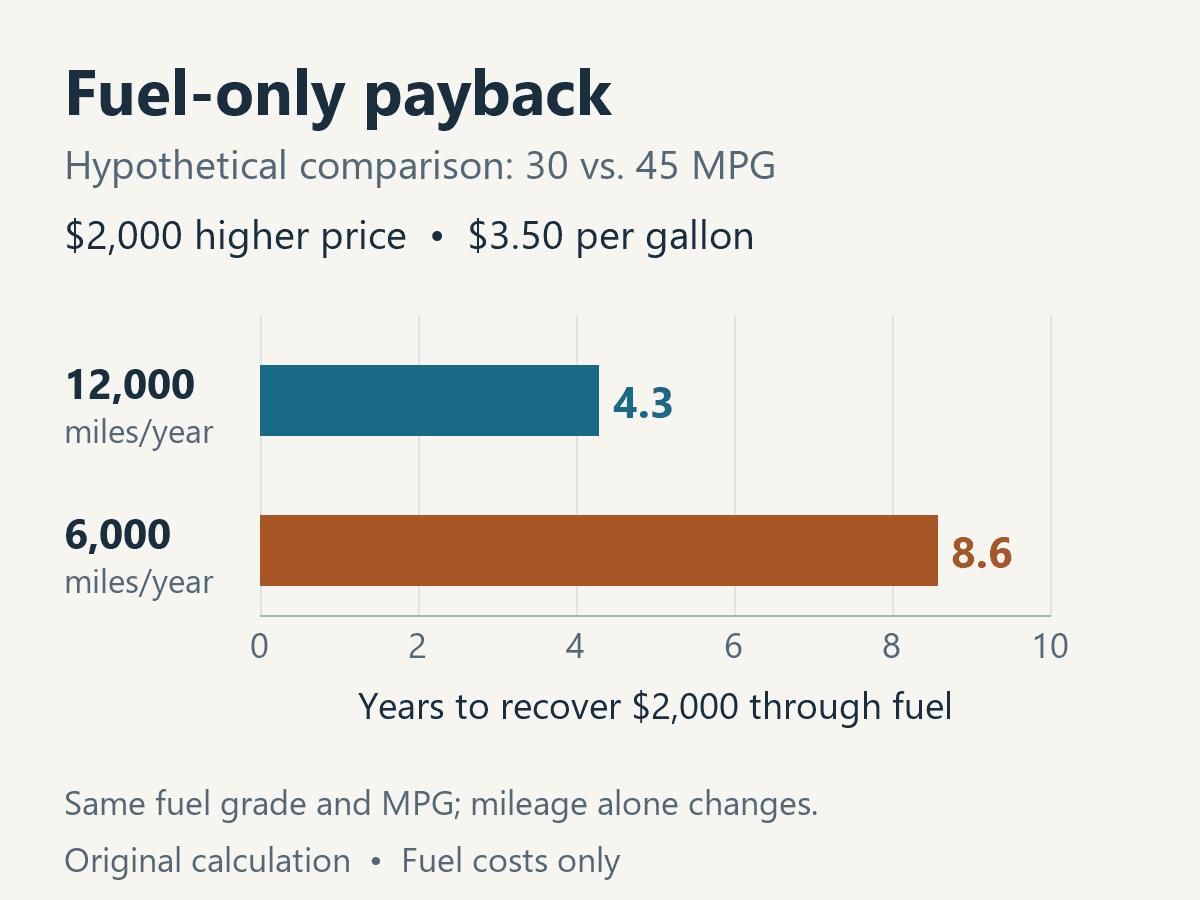
If the 45-MPG vehicle costs an additional $2,000 to buy, dividing that premium by the unrounded annual fuel-cost difference gives a simple fuel-only payback of about 4.3 years. At 6,000 miles a year, with every other assumption unchanged, the annual difference falls to about $233 and the payback stretches to about 8.6 years.
This example isolates one expense. It includes no financing, taxes, insurance, maintenance, repairs or eventual resale proceeds. A different purchase-price gap or gasoline price changes the answer. The calculation can be useful even when the fuel saving never recovers the entire premium during the planned ownership period: it shows the size of the fuel benefit being weighed against other reasons for choosing the vehicle.
Use comparable ratings and the fuel each car requires
The DOE/EPA fuel-economy guidance explains that standardized ratings are useful for comparisons but may not predict an individual driver’s MPG. Driving conditions, vehicle condition, fuel and other factors can change consumption. Use the same kind of rating for both vehicles, then consider a second scenario based on a realistic expectation for your own use.
For real configuration examples, our 2026 hybrid SUV MPG comparison separates the Niro FE, RAV4 Hybrid and CR-V Hybrid records, including the specified FWD and AWD versions. That is the level of detail to match before putting an MPG figure into a fuel-cost calculation.
A conventional hybrid also belongs in a different calculation from a plug-in hybrid. The Department of Energy describes an HEV as combining an engine with electric propulsion, with its battery charged through regenerative braking and the engine rather than an external plug. A plug-in comparison needs electricity use and charging assumptions as well as gasoline consumption.
For a purchase decision, replace the hypothetical price premium with comparable written prices for the configurations you would actually buy. A base-model ranking cannot resolve a comparison in which one vehicle adds equipment you want and the other does not. Keep that equipment decision visible alongside the annual gallons and dollars.
0 comment(s) so far on Hybrid Value: MPG Scores, Fuel Cost and Payback