

2026 Hybrid SUV MPG: Niro, RAV4 and CR-V Compared
2026 fuel economy comparison
Updated October 16, 2026
The 2026 Kia Niro FE, Toyota RAV4 Hybrid and Honda CR-V Hybrid show why an SUV’s name is not enough to identify its fuel economy. The five EPA configurations below range from 37 to 53 MPG combined. They offer a useful comparison of specific versions, rather than a nationwide “best SUV” ranking.
Five exact 2026 configurations
This comparison selects three U.S. non-plug-in hybrid model families and includes FWD/AWD records for the RAV4 and CR-V to show configuration differences. Every row uses regular gasoline. The rows are ordered by published combined MPG; they are not an exhaustive survey of SUVs, an equipment match or a ranking within one EPA size class.
| Configuration and EPA record | City MPG | Highway MPG | Combined MPG |
|---|---|---|---|
| Kia Niro FE — FWD | 53 | 54 | 53 |
| Toyota RAV4 Hybrid — FWD | 47 | 40 | 43 |
| Toyota RAV4 Hybrid — AWD SE & LE | 46 | 39 | 42 |
| Honda CR-V Hybrid — FWD, 2.0-liter | 43 | 36 | 40 |
| Honda CR-V Hybrid — AWD, 2.0-liter | 40 | 34 | 37 |
“Niro FE” is the EPA record name used here, not a promise of 53 MPG for every Niro. The CR-V rows are the 2.0-liter hybrid records, not the 1.5-liter turbo versions. The RAV4 AWD rating shown is specifically the SE/LE record; it should not be assigned to every AWD grade.
Read city and highway figures alongside combined MPG
The Niro FE has the highest combined estimate in this selection and a 54-MPG highway rating. The FWD RAV4 is rated at 47 city and 40 highway; the FWD CR-V hybrid at 43 city and 36 highway. Those separate columns help compare vehicles for different driving patterns instead of assuming the combined number describes every journey.
The RAV4 records differ by one combined MPG, while the CR-V records differ by three. These are comparisons of complete configurations, not controlled tests isolating the mechanical effect of AWD. Match the model year, powertrain and grade to the actual vehicle’s label before using a number in a purchase calculation.
Turn MPG into gallons before comparing fuel cost
A higher MPG number does not translate into the same fuel reduction for every step. Using 12,000 miles per year and an assumed $4 per gallon, a 53-MPG vehicle would use about 226.4 gallons, costing $906. At 40 MPG, the same distance would use 300 gallons, costing $1,200. The illustrative difference is about $294 in gasoline for that year.
The formula is annual miles ÷ MPG × price per gallon. Replace both assumptions with your own figures; this is not a current fuel-price quote or a prediction of actual results. It does not establish whether a higher purchase price is recovered or which vehicle costs less to own overall.
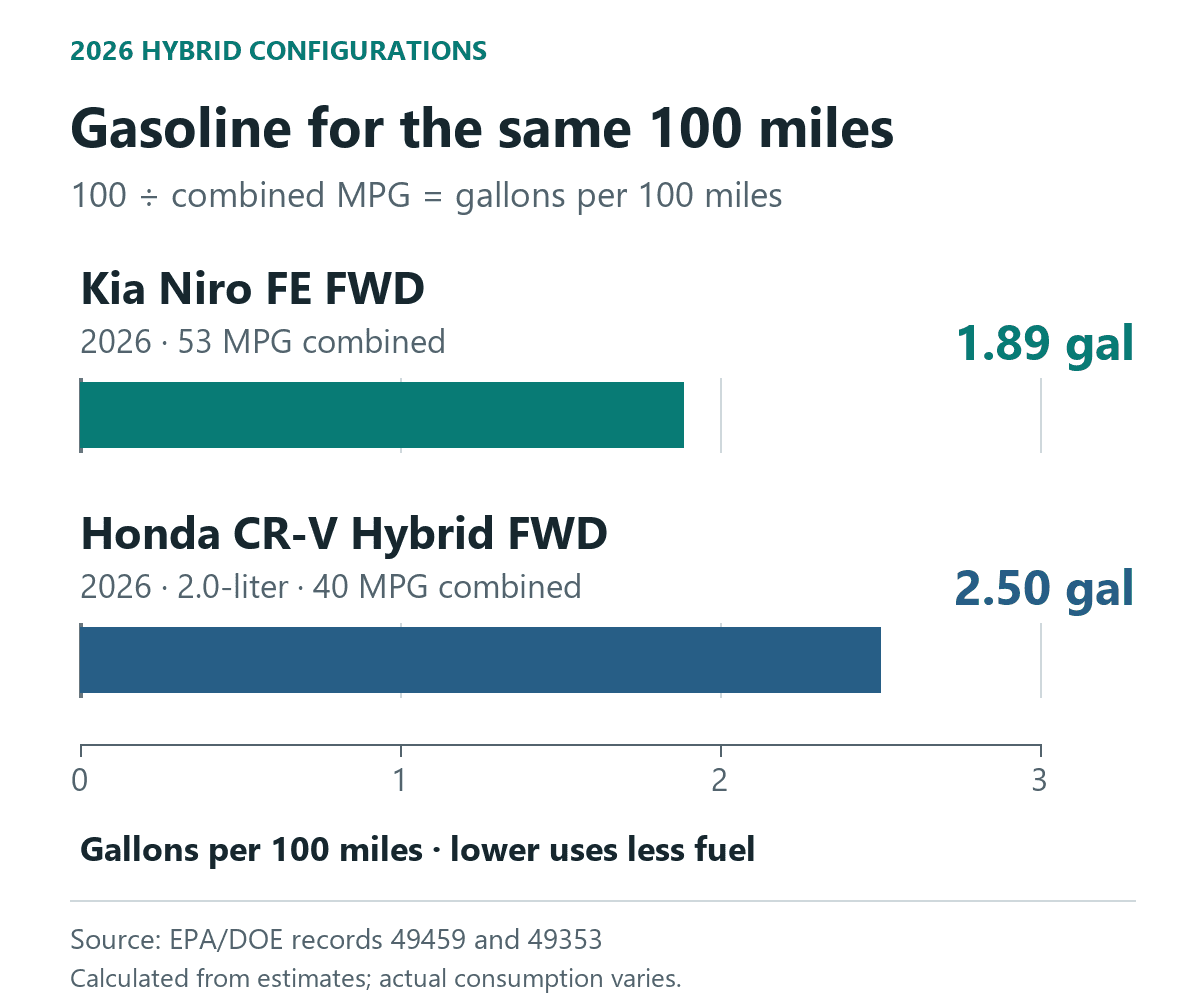
For a shorter comparison, divide 100 by MPG: the same estimates become about 1.89 gallons per 100 miles at 53 MPG and 2.50 at 40 MPG. Lower consumption means less gasoline for that fixed distance.
Keep plug-in and electric measurements separate
The EPA’s plug-in-hybrid label guide separates MPGe during electric operation from gasoline MPG after usable plug-in energy is depleted. MPGe expresses energy-equivalent efficiency; it is not gasoline mileage or electric range. Compare the gasoline figure, electricity consumption in kWh per 100 miles and electric range as separate values.
For an EV, likewise distinguish energy consumption from miles of range. A fuel-economy comparison cannot by itself show what a mixed gas-and-electric driving routine will cost. The EPA label also notes that driving, weather, loads and accessory use can change results. A useful comparison starts with the exact configuration and the energy units your routine will actually use.
0 comment(s) so far on 2026 Hybrid SUV MPG: Niro, RAV4 and CR-V Compared