

New-Car Affordability Slips in September as Payments Rise
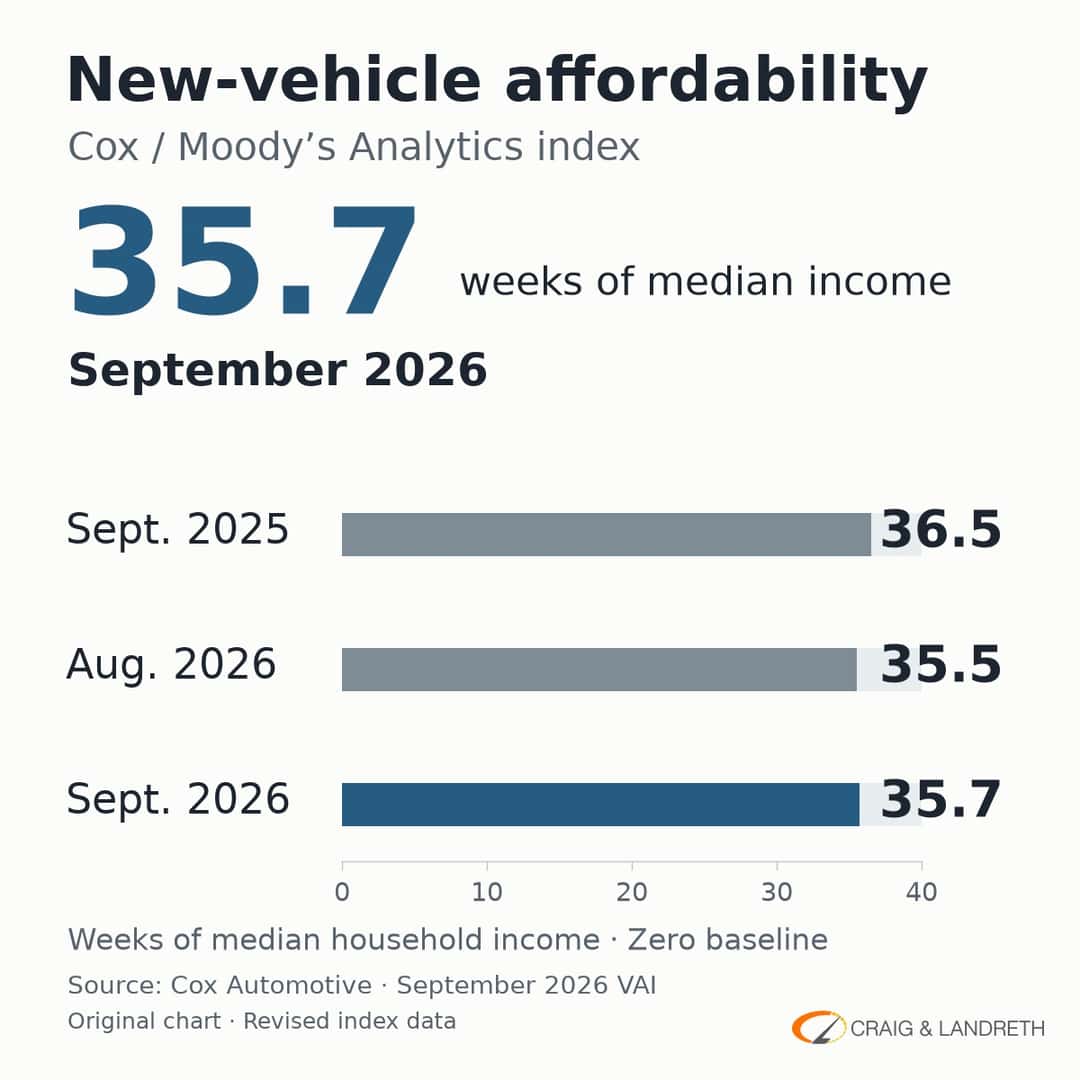
New-vehicle affordability weakened in September even though the borrowing rate used in the Cox Automotive/Moody’s Analytics Vehicle Affordability Index edged lower. The September report, released October 19, puts the cost of an average new vehicle at 35.7 weeks of median household income, compared with 35.5 weeks in August. A higher reading means a larger income burden in this measure.
The year-over-year comparison was more encouraging: September 2025 required 36.5 weeks. Cox’s typical modeled monthly payment rose to $776 in September, while its estimated loan-rate input slipped to 9.45%. The report attributes the monthly setback to vehicle-price increases outweighing the help from income growth, incentives and the small rate decline.
Cox flags the index figure as updated after initial publication. This article uses the revised value displayed in the report when reviewed on October 20.
Why the $50,562 average needs context
Kelley Blue Book’s September transaction-price report, published October 13, lists an industry average of $50,562. That was 0.9% above August and just below the December 2025 record of $50,614. But the same report shows wide differences between common vehicle categories: compact cars averaged $27,977, subcompact SUVs $31,213 and compact SUVs $37,614.
KBB says stronger sales of lower-priced vehicles helped restrain the industrywide increase. That is a sales-mix effect, rather than evidence that every model became cheaper. Its compact-SUV average was down 0.4% from a year earlier, while compact cars were up 3.2% and subcompact SUVs were up 1.5%. Those categories did not move in the same direction.
For a shopper, the useful starting comparison is therefore the kind of vehicle that meets the household’s needs. Comparing a compact-car quote with the entire new-vehicle market can obscure the relevant alternatives. The national average helps describe what sold; it does not establish a minimum entry price, the price of a particular trim or the amount someone must spend.
What the affordability index actually models
The published Cox/Moody’s methodology combines vehicle transaction prices, median household income, financing assumptions and interest rates. It assumes a 10% down payment and a 72-month loan. Its rate input is designed to represent a fixed-rate loan of that length. Those are consistent assumptions for tracking market changes, not a recommendation that an individual buyer select that down payment or term.
The income measure is for a household, rather than an individual worker’s paycheck. The weeks figure expresses the modeled vehicle burden relative to that income benchmark; it is not the duration of the loan or a suggested period for saving. Nor does the published framework prescribe how much of a particular household’s budget should go toward a vehicle.
A modeled payment is different from an offer
The $776 figure is useful as a marker of the market’s direction. It is not a payment available to every applicant, an approval prediction or a quote for one of the lower-priced categories. Applying it to a compact car simply because that car appears in the same report would mix two different levels of information: a national model and a specific purchase.
An actual comparison needs the vehicle price and the financing details together. If two offers show different monthly payments, first identify whether the vehicle, down payment, financed amount, rate or term also differs. Otherwise, the payment difference cannot be attributed to price alone. Keeping those inputs visible makes it easier to understand what each offer is actually comparing.
The index also cannot decide whether a vehicle fits a household’s other obligations. Insurance, fuel or charging, maintenance and the money available for an initial payment belong in a separate ownership-budget review. They should not be assumed to be covered by the headline modeled payment. A market benchmark can provide context without resolving those personal questions.
September’s result leaves two messages for buyers to keep separate: affordability can worsen from one month to the next while remaining better than a year earlier, and a high industry average can coexist with substantially lower-priced vehicle categories. The stronger comparison is the exact vehicle and complete transaction being considered, with the national figures used as context rather than a spending target.
0 comment(s) so far on New-Car Affordability Slips in September as Payments Rise