

Used EV Price Premium Narrows as Sales Share Hits a High
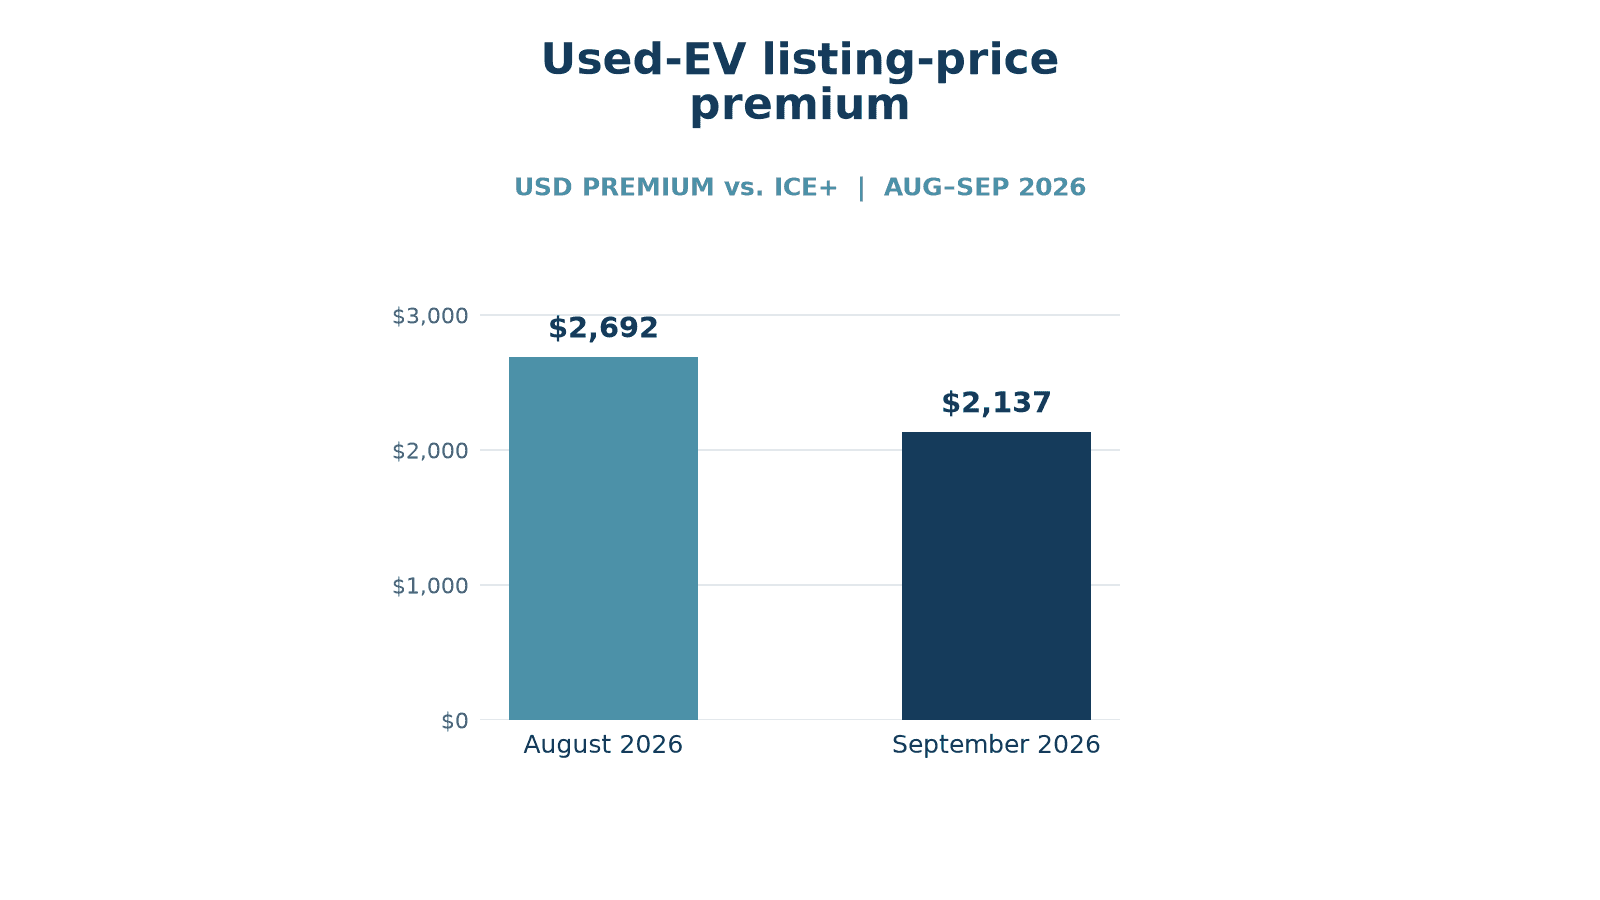
Used electric vehicles reached a record share of used-vehicle sales in September while their average listing-price premium over the comparison market narrowed, according to new Cox Automotive estimates. The report was released October 16 and describes September conditions.
Estimated used-EV sales reached 47,862, up 12.3% from August and 21.2% from a year earlier. Their share of used-vehicle sales rose to 3.3%, compared with 2.9% in August. The figures describe the used market and should not be read as another measure of new-EV sales.
A smaller price gap, not universal price parity
Cox’s September EV Market Monitor puts the average used-EV listing price at $36,767, down 1.8% from August but up 6.4% year over year. The premium over its ICE+ comparison group narrowed to $2,137, or 6.2%, from $2,692 in August.
That is an average across the listings included in the analysis. It does not establish that every EV is cheaper than a gasoline alternative, or that matching vehicles differ by precisely $2,137. A changing mix of models, ages and equipment can affect an average. Listing prices also differ from final transaction prices.
Used-EV days of supply fell to 35, compared with 46 for ICE+. A tighter supply measure is not evidence that every model is readily available. It describes inventory relative to recent sales activity, and should be kept separate from the condition and availability of a specific car.
Turn the market trend into a vehicle comparison
The useful next step for a shopper is to compare actual alternatives that serve the same purpose. Keep the model year, trim, equipment, condition and purchase terms visible. An appealing national average cannot determine whether one vehicle fits a household’s travel or charging routine.
The federal electric-vehicle label guide explains the difference between driving range, MPGe and electricity consumption in kilowatt-hours per 100 miles. Those measures answer different questions. A range figure describes distance under the rating procedure, while electricity consumption helps estimate how much energy must be purchased for a distance.
The label’s annual fuel-cost estimate uses standardized assumptions. For a personal comparison, use the electricity prices and annual mileage relevant to the household. Separate routine home charging from public charging when their costs differ, rather than assuming one energy price applies to every trip.
Purchase savings and running costs are separate inputs
The Department of Energy’s vehicle cost calculator lets shoppers explore how vehicle choice and driving assumptions affect estimated costs. The result is a comparison aid, not a quote for the particular used car. Insurance, financing and the actual purchase offer need their own evidence.
Battery information deserves the same care. A displayed remaining-range estimate is not by itself a complete inspection of a used EV’s battery. Ask what any battery report measures, how it was produced and which vehicle it describes. Charging compatibility and the equipment included with the car should also be confirmed for that specific example.
The September report provides a useful reason to revisit the used-EV market: its average price premium has narrowed while sales share has increased. It does not settle the buying decision. That requires matching the price of the actual vehicle with its capabilities, condition and expected use.
0 comment(s) so far on Used EV Price Premium Narrows as Sales Share Hits a High