

EV Fast Charging: Compare Stop Time, Not Just Peak kW
A large fast-charging number can make an electric vehicle sound like an obvious road-trip choice. But a maximum power rating does not tell you how long a useful charging stop will last. To compare EVs, look at the energy needed for the next leg and the vehicle’s charging time over a stated interval, as well as its peak capability.
The familiar 10–80% figure is one such interval. It describes movement between two battery charge levels under stated conditions. It can be more useful than a peak-kilowatt headline, but it still needs context: different batteries add different amounts of energy over the same percentage change.
Power and energy answer different questions
Kilowatts measure power, the rate at which energy is transferred. Kilowatt-hours measure energy. The Department of Energy’s charging-equipment explanation identifies battery capacity, starting state of charge, vehicle capability and equipment output among the factors affecting charging time. The number printed on a charging station is not a promise that every connected car will receive that power throughout a session.
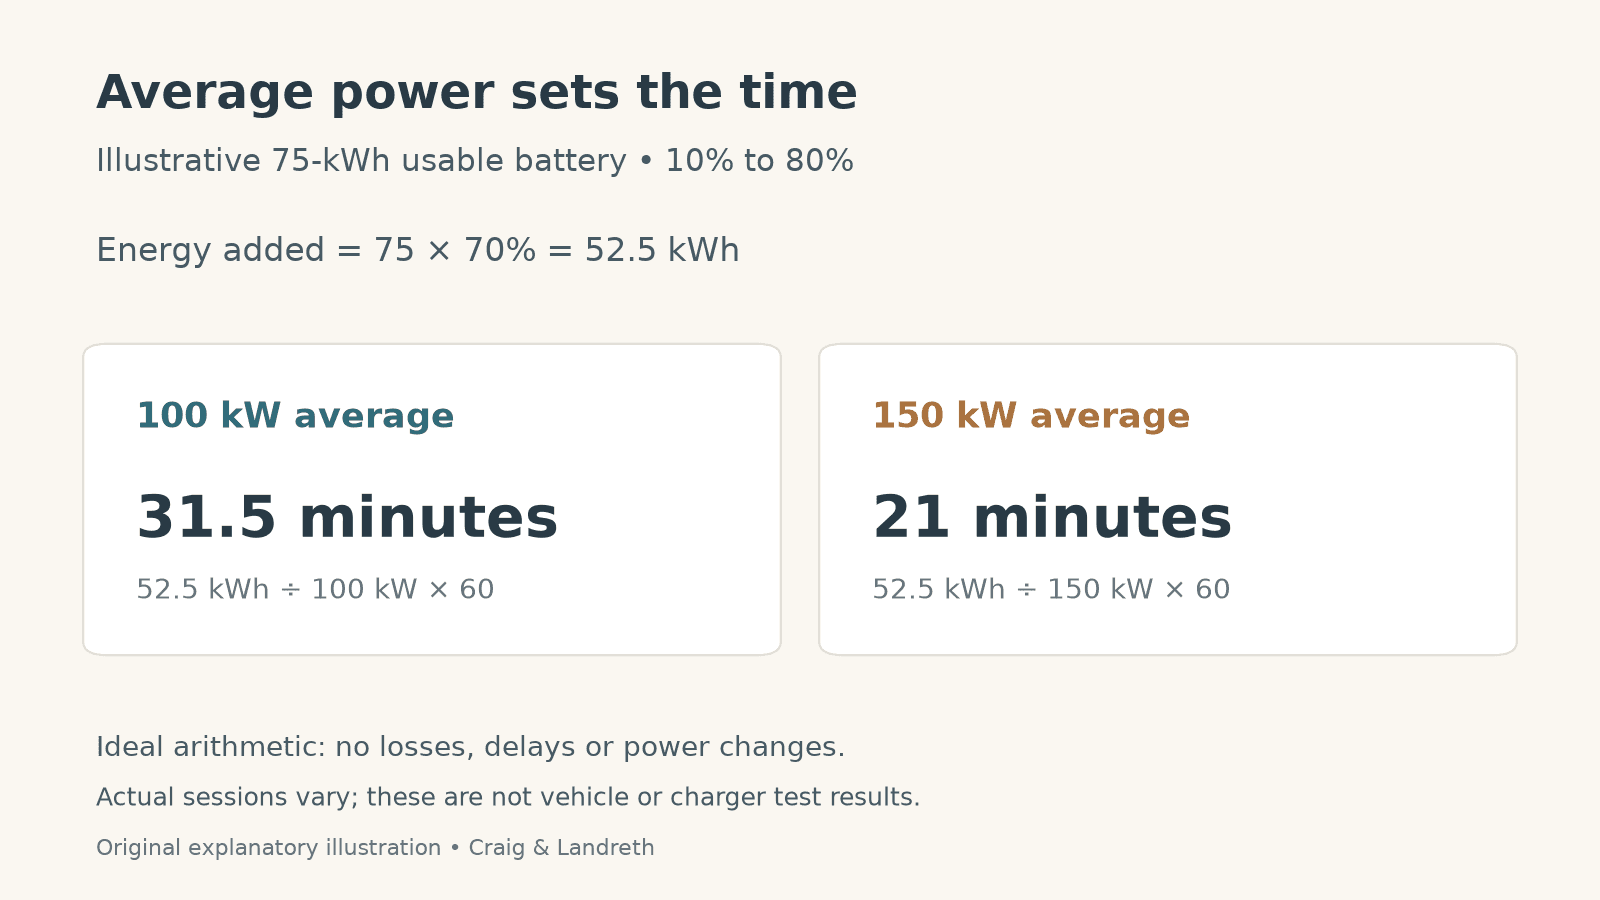
A simple calculation shows why the average matters. Consider an illustrative battery with 75 kWh of usable capacity. Moving from 10% to 80% adds 70% of that capacity, or 52.5 kWh. At an average battery-side charging power of 100 kW, that energy transfer takes 31.5 minutes. At an average of 150 kW, it takes 21 minutes.
Those are arithmetic examples, not measurements of an actual vehicle. They assume that average power applies across the whole interval and exclude connection delays and other overhead. Station-metered energy can also exceed the energy stored in the battery because of losses and vehicle energy use. A brief 150-kW peak does not establish a 150-kW average.
Why charging slows before the battery is full
A charging curve describes how power changes as the battery fills. The Department of Energy’s cold-weather EV guidance notes that most batteries reduce fast-charging power in the 80–100% range. That can make the final portion of a stop take longer than its percentage gain suggests.
It does not make 80% a universal departure target. A longer gap between reliable chargers, cold weather or a demanding next leg may justify more charge. Compare the planned arrival reserve and the next available charging opportunities, rather than treating an advertised benchmark as a rule for every trip.
For shoppers comparing published times, check the starting and ending percentages, battery version, charger requirements and temperature assumptions. A 10–80% claim and a 20–80% claim cover different amounts of energy. A larger battery can take longer to fill by the same percentage while still adding useful driving distance.
Preconditioning and the route change the comparison
Battery temperature is another part of the stop. Tesla’s Model S charging instructions advise navigating to fast chargers to allow battery preconditioning and note that lower charge levels typically permit faster charging. That is a model-specific operating example; another EV’s menu, supported locations and battery preparation may differ.
Before relying on that function, verify the exact vehicle’s instructions and compatible charging locations. Cabin heating and preparation of the battery for fast charging are related uses of energy, but selecting a comfortable cabin temperature alone does not establish that a battery is ready for its fastest charge.
A useful road-trip comparison therefore combines published charging time with realistic route energy needs and the right equipment. Look for repeatable tests that disclose those conditions, and keep time spent waiting or connecting separate from active energy-transfer time. Peak power is a capability worth knowing; the whole stop is the experience a driver actually needs to plan.
0 comment(s) so far on EV Fast Charging: Compare Stop Time, Not Just Peak kW