

September Manheim Index: What the Wholesale Number Measures
Used-Vehicle Market
Updated October 16, 2026
The September 2026 Manheim Used Vehicle Value Index fell to 205.9, down 1.1% from August and 0.6% from a year earlier. That is a measure of adjusted wholesale used-vehicle prices. It is useful market context, but it cannot tell a shopper what a particular car should cost or a seller what trade-in offer to expect.
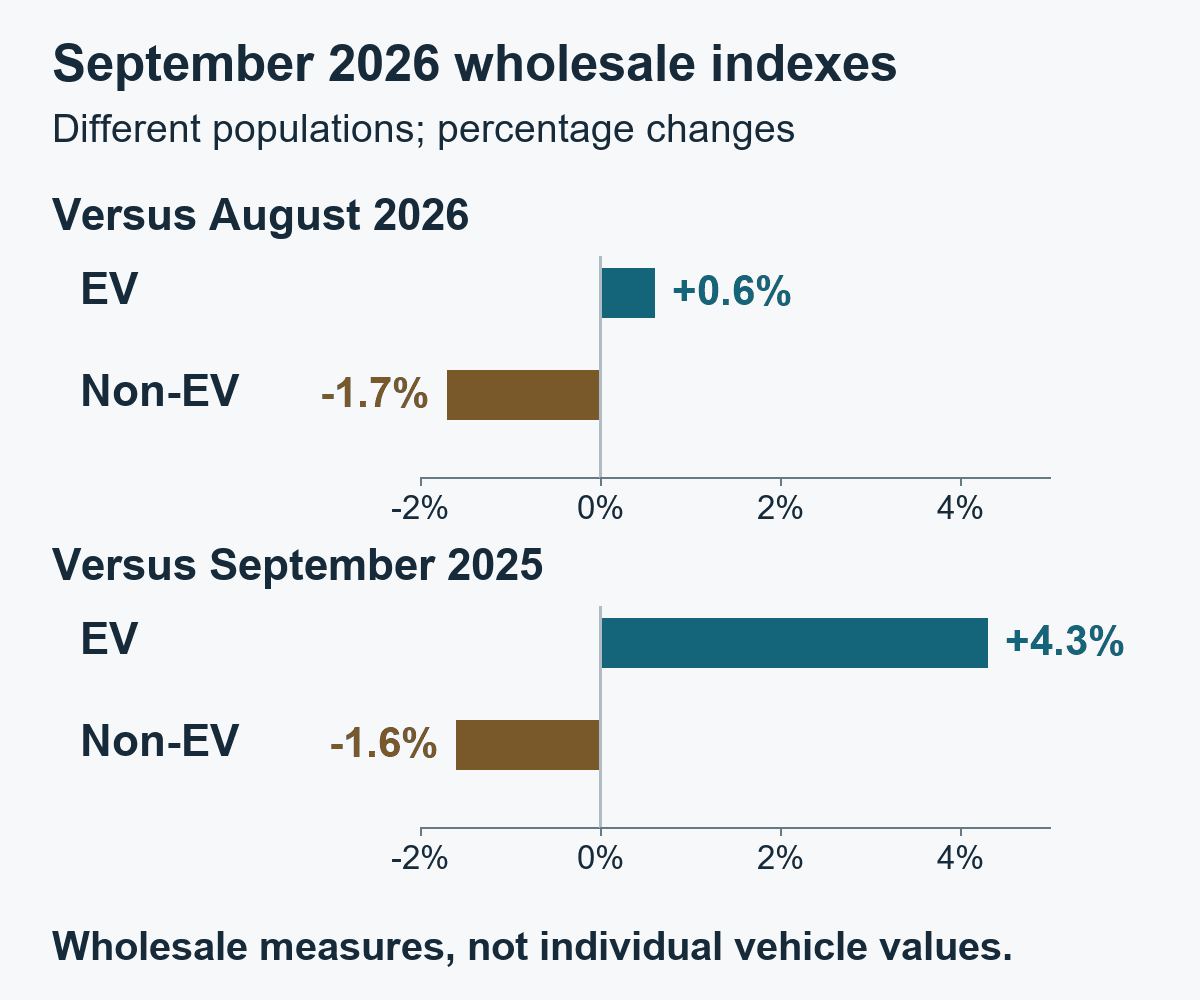
What the September figures measure
Cox Automotive published the September report on October 7. It separates the headline index, adjusted for vehicle mix, mileage and seasonality, from non-adjusted wholesale prices. Its EV and non-EV indexes also moved differently.
| Measure | Versus August 2026 | Versus September 2025 |
|---|---|---|
| Adjusted overall index | −1.1% | −0.6% |
| Non-adjusted wholesale prices | −1.3% | −1.2% |
| EV index | +0.6% | +4.3% |
| Non-EV index | −1.7% | −1.6% |
A falling overall index can coexist with a rising segment index. Neither result says every vehicle in that group changed by the published percentage. The overall number and the EV number also describe different populations, so they should not be used interchangeably.
Why Manheim adjusts the transactions
The published methodology summary starts with Manheim U.S. sales in 20 market classes, excluding categories such as heavy trucks and motorcycles. It removes transactions meeting its price-and-mileage outlier rule, then calculates sale-price and mileage averages by class.
It adjusts for mileage using a relationship between price and miles within each market class. Class weights use a rolling 24-month average of sales. Finally, the mix- and mileage-adjusted total receives a seasonal adjustment. This is a statistical series built from wholesale transactions, rather than the unfiltered average price of every used vehicle offered for sale.
Those steps help distinguish a market movement from changes in the vehicles passing through the sample. They do not examine the condition or repair needs of the individual car in front of you. The adjusted and non-adjusted results are separate views of the data, not percentages to combine into another price change.
205.9 is an index level, not a dollar price
Cox’s rebasing explanation sets January 1997 equal to 100. It replaced the older January 1995 base beginning with the January 2023 release. Comparing index levels from differently based charts can therefore produce a misleading impression, even when the more recent monthly percentage changes agree.
The September data workbook lists the overall index at approximately 208.178 for August and 205.882 for September. Dividing the September level by August’s and subtracting one gives about −1.103%, which rounds to the reported −1.1%. The calculation concerns the series; it does not revalue a particular VIN.
Use it as context for a vehicle-specific comparison
A 1.1% wholesale decline is not an automatic discount to apply to a retail advertisement or an earlier appraisal. An asking price, a completed sale and an offer to buy your car are different pieces of evidence. Keep their dates, vehicle configuration, mileage and stated condition visible when comparing them.
Condition needs its own evidence. The used-car inspection checklist explains how to record observations and obtain specific findings; it does not assign a value. A wholesale index cannot replace that condition review or establish an amount a buyer or seller will accept.
0 comment(s) so far on September Manheim Index: What the Wholesale Number Measures