

IIHS Driver Death Rates: What the 2026 Study Can Tell You
Safety research
Updated October 16, 2026
IIHS driver death rates describe real-world outcomes for groups of vehicles and drivers. They are useful evidence when comparing cars, but a low figure is not a promise of survival, and a missing result is not a zero. The 2026 study also looks backward: it does not measure the newest vehicles on sale.
Start with the period and the denominator
In its July 30, 2026 report, the Insurance Institute for Highway Safety examined fatalities during 2021–2024 to estimate outcomes for 2023 models. It included equivalent designs from as far back as the 2020 model year where there had been no substantial redesign. That is different from treating every 2020–2023 vehicle with the same name as interchangeable.
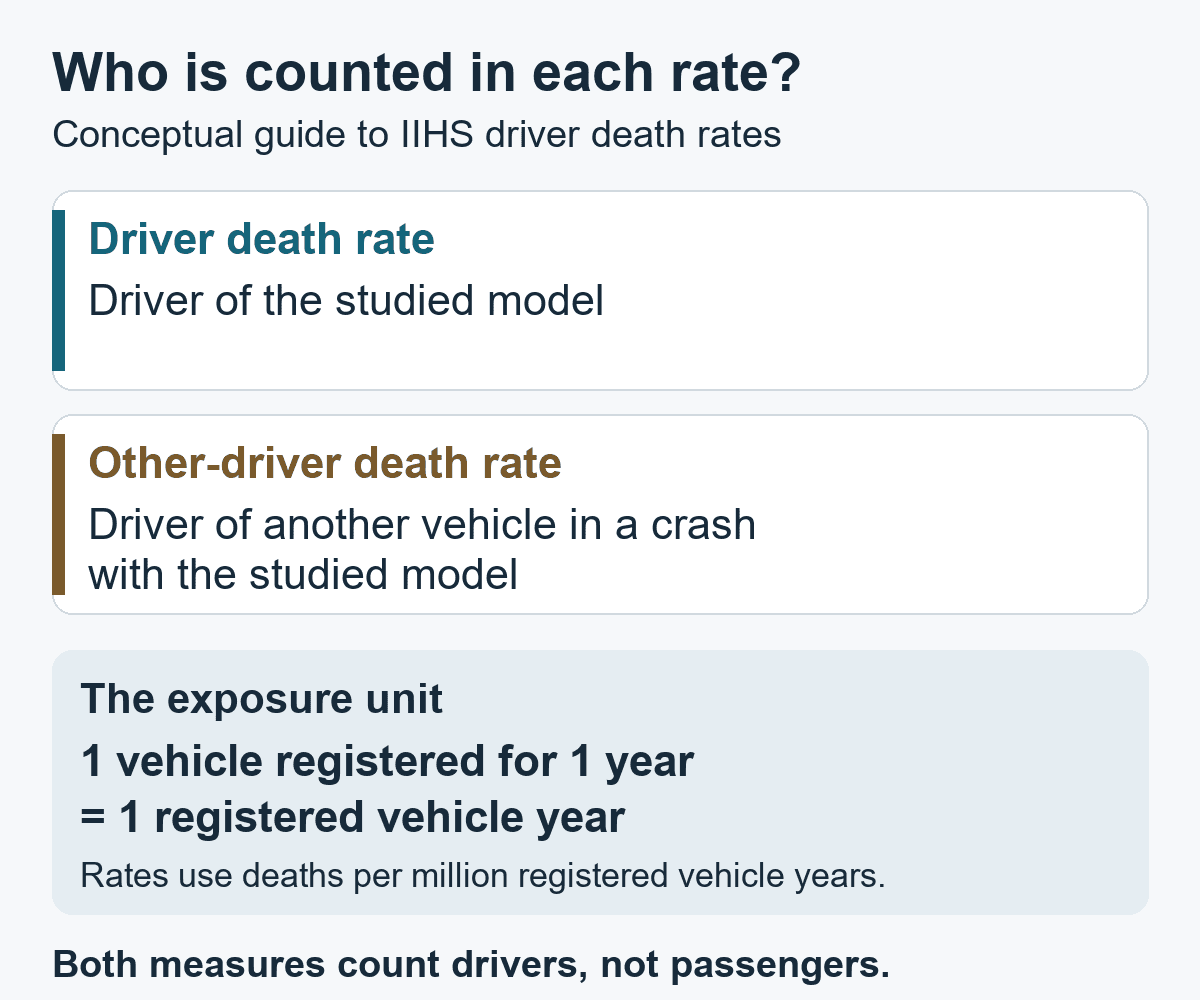
The study reported an overall driver death rate of 37 per million registered vehicle years and an other-driver death rate of 53. The second measure concerns drivers of vehicles that collided with the model being studied. It is not a second count of occupants in that model.
| Part of the result | What to establish |
|---|---|
| Vehicle series | Model, body style, drivetrain and included years |
| Exposure | Registered vehicle years, rather than a raw death count |
| Uncertainty | The interval beside the estimate |
| Outcome | Deaths of the studied vehicle’s drivers or other vehicles’ drivers |
A registration year is not a mile
The IIHS data resource defines a registered vehicle year as one vehicle registered for one year. A model needs at least 100,000 registered vehicle years or at least 20 deaths during the four-year study period to receive an individual estimate.
The rates are adjusted for driver age and sex, but the news report explains that they are not adjusted for driving speed or miles traveled each day. Differences between models therefore cannot all be assigned to their structure or safety equipment. A year of registration does not tell us how much an individual owner drove.
Read the 95-percent confidence bounds alongside the point estimate. IIHS describes narrower intervals as more statistically reliable. Small differences deserve caution, particularly when the intervals are wide. Turning a table into a precise best-to-worst shopping order discards that uncertainty.
A zero driver death rate does not mean zero risk
Six models in the study had a driver death rate of zero. That result concerns the observed study population and period. It cannot guarantee what happens in a future crash. Likewise, a vehicle absent from the individual-model table may lack sufficient exposure; absence does not establish a favorable safety result.
Use crash tests for a different question
The institute’s vehicle ratings distinguish crashworthiness, meaning occupant protection in a crash, from crash avoidance and mitigation. Those controlled evaluations provide a different view from population outcomes. Search the actual model year and read the test details instead of transferring an older result to a redesigned car.
Keep a small comparison sheet with the included study years, the exact rating page and the equipment on the vehicle under consideration. If a safety feature is optional, establish whether that particular vehicle has it. A photograph of a similar trim or the name of an equipment package is not enough to settle that question.
The aim is a decision you can explain: what the study measured, what the crash tests evaluated and what remains unknown about the actual vehicle. No one number supplies all three answers, and neither a high price nor a large body establishes that every part of the safety assessment is favorable.
0 comment(s) so far on IIHS Driver Death Rates: What the 2026 Study Can Tell You