

Leading Tire Manufacturers by Reported Annual Sales
Industry figures explained
The largest tire manufacturer depends on what is being measured. Annual revenue, tire-only revenue and the number of tires sold describe different kinds of scale. The five manufacturers below publish useful 2025 results, but their reports do not form a clean, like-for-like world ranking—and company size does not identify the best tire for a particular vehicle.
Updated October 16, 2026
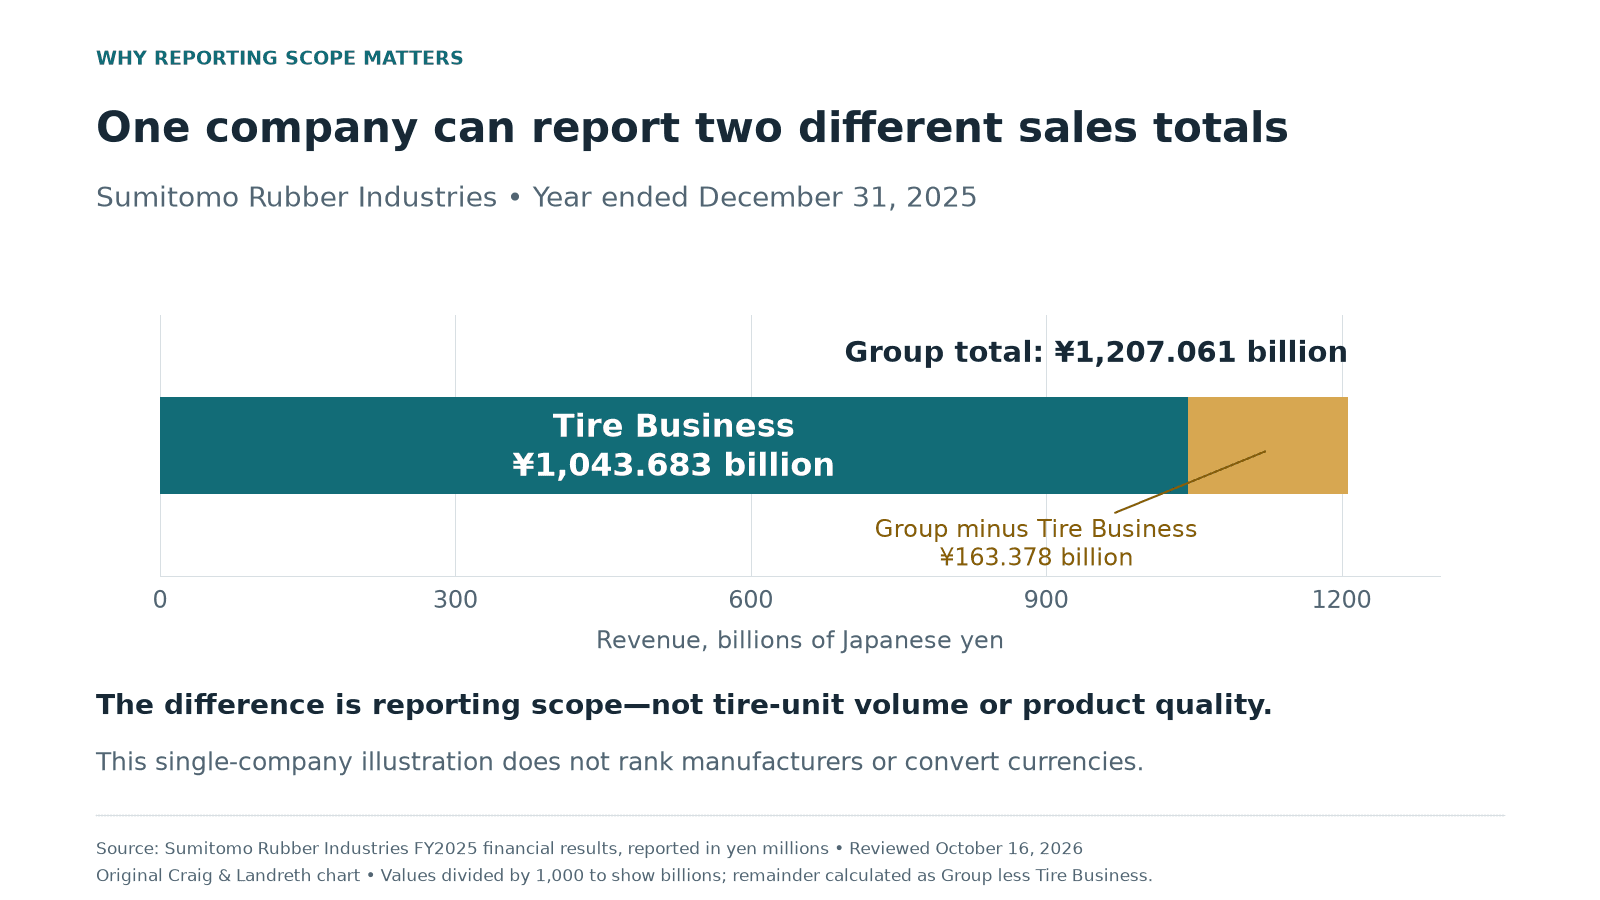
Five reported results, with their scope attached
This comparison uses the year ended December 31, 2025. Amounts remain in their reported currencies. The order is alphabetical, not a ranking. Group sales can include activities beyond tires, while a tire-segment figure covers a narrower business.
| Manufacturer | Reported figure | What it measures |
|---|---|---|
| Bridgestone | ¥4,429.452 billion | Consolidated revenue from continuing operations |
| Continental | €13.798 billion | Tires-sector sales |
| Goodyear | $18.3 billion; 158.7 million tire units | Company net sales; separately reported tire unit volume |
| Michelin | €26.0 billion | Group sales, including non-tire activities |
| Sumitomo Rubber Industries | ¥1,043.683 billion | Tire Business revenue |
Group revenue and tire revenue are not interchangeable
Michelin’s 2025 financial announcement reports €26.0 billion in Group sales and explicitly notes contributions from non-tire businesses. It therefore should not be presented as revenue earned only by selling tires, even though tires are central to the company.
Bridgestone’s full-year statements report ¥4,429,452 million of revenue from continuing operations. The table expresses that same amount in billions. This is a revenue figure, not a tire-unit count.
Continental’s Tires-sector report provides a narrower €13,798 million sales figure. The sector includes several tire categories and tire-related products and services. That is more specific than whole-company sales, but it still does not measure only the passenger-car replacement tires a shopper may be comparing.
Sumitomo Rubber’s 2025 report makes the distinction especially clear: total Group revenue was ¥1,207,061 million, while Tire Business revenue was ¥1,043,683 million. Its sports and other businesses account for part of the difference. Substituting one figure for the other would change the comparison.
Unit sales answer another question
Goodyear reported $18.3 billion in net sales and 158.7 million tire units for 2025. The unit figure is useful context without a currency conversion, but it is not the same measure as revenue. The company also identifies divestitures during the year, including its chemical and off-the-road businesses and the Dunlop brand transaction.
A tire count treats a small passenger tire and a much larger commercial tire as units, even though their selling prices can differ substantially. Revenue also reflects product mix and selling prices. More units therefore do not automatically mean more revenue, and a higher revenue figure does not establish more passenger tires sold.
Currency conversion would address only one part of the problem. Converting yen, euros and dollars into a common currency still leaves the reporting-scope differences. A defensible ranking would need a stated exchange-rate method, the same measurement period and a consistent definition of tire sales across every company included.
What a tire shopper should take from the comparison
These figures show the scale of several manufacturers, rather than test results for individual products. They do not compare stopping distance, wet grip, winter capability, road noise or tread life in the size fitted to a specific car. They also do not identify a universally best brand or a warranty result for an individual tire.
Start a replacement decision with the vehicle’s required size and load specifications, then compare the actual tire models suited to the driving conditions. NHTSA’s tire guidance explains identification, condition and pressure checks. The vehicle placard and owner’s manual supply the recommended cold pressure; the maximum molded on the sidewall is not the vehicle’s pressure recommendation.
Keep the product name, exact size, specification and installed-price quote together when comparing options. A manufacturer’s global sales total is background information. The useful purchase comparison is between the actual tires that fit the vehicle and the performance and service requirements that matter to its owner.
0 comment(s) so far on Leading Tire Manufacturers by Reported Annual Sales